Data is the new oil. Deciding what to build in a product is powered by this oil. Especially in B2C products where its virtually impossible to talk to every customer and build product based on that. Instead data act as the indicators which reflect consumer feedback and is used in driving product decisions.
As product managers, we subject users to different "experiences" and based on the choices they make, it tells PMs whether it is helping customers or not. Product managers act like scientists who change small things in the product and measure consumer response. If the changes help in improving the metrics which the PM is aiming to move, then the experiment is considered as success, else it's a failure. In typical spirit of the scientific method, failures are not bad as long as the experiment was correctly designed and we learn something from it.
A few terms in this definition need special care and should be clearly defined.
- Metrics - These are numbers which the PM is trying to move. This could be conversion of users landing on the home page, or number of uninstalls within 7 days of installs, etc. All these numbers should be carefully defined to design the right experiment and move the metrics.
- Measurement - As the famous saying by Peter Drucker goes
If you can't measure it, you can't improve it.
Though it is also important to measure correctly - so that the metric being measured actually reflects the goal.
For example, if you are trying to improve retention for an app, what is the best metric to measure. Is it uninstall rates or is it the retention cohorts? Should D7 uninstall rates be measured or D30?
Since, data is so crucial, it is also important that we are able to capture the right data points and analyse them in a variety of ways. Different ways of looking at data can reveal patterns which have interesting insights to improve product metrics. This is especially important when PMs are deciding to build new features
This also needs that the data stack being used is flexible enough to support different ways of querying and it is easy to query them. If something is difficult to do, then humans will infallibly try to avoid that.
There has been huge increase in demand for data analysts - who can provide insights to the respective teams. But in my opinion, adding one more layer of people assigned just for the task of doing data analysis makes the process slow. If a product manager is trying to get data on how different features are used by customers, he should be able to just dive right into the data - and get the insights quickly - in a user friendly way. Similarly, if marketing wants to learn how users from different marketing channels are performing in terms of their retention, then they should be able to just make a few clicks to get this data.
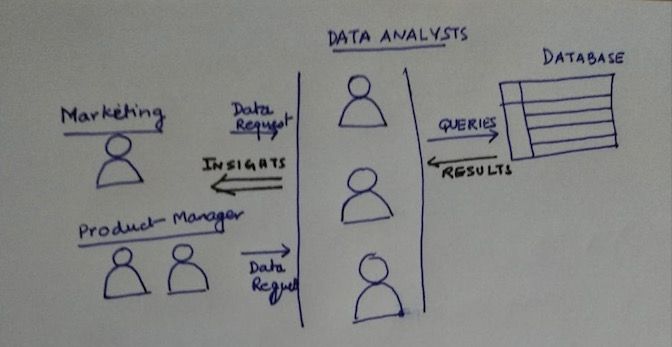 Data Analysts as bottlenecks
Now, the issue is - this needs good knowledge of how the data is being stored in the DBs and what type of values they have. For non-technical roles like marketing, PMs, this may be non-trivial problem to solve. Just having a data analyst doesn't solve the problem. Also, you are not entirely sure if the results which an analyst gives you is the exact thing which you are looking for.
Data Analysts as bottlenecks
Now, the issue is - this needs good knowledge of how the data is being stored in the DBs and what type of values they have. For non-technical roles like marketing, PMs, this may be non-trivial problem to solve. Just having a data analyst doesn't solve the problem. Also, you are not entirely sure if the results which an analyst gives you is the exact thing which you are looking for.
One the important metrics to measure data analytics ease is to measure how many people are using it. If more and more people in the organization are using data to power their decision, then the data platform is generating value for the company and hopefully powering good decisions.
Some current data analytics tools which are used by companies for visualizing their business specific data are:
All these tools have their own pros and cons. I will try to delve deeper into this in later posts.
Meanwhile, would love to understand how do you visualise you business metrics currently? How happy are you with it - and what are the challenges you face?
Drop me a note on twitter @pranay01
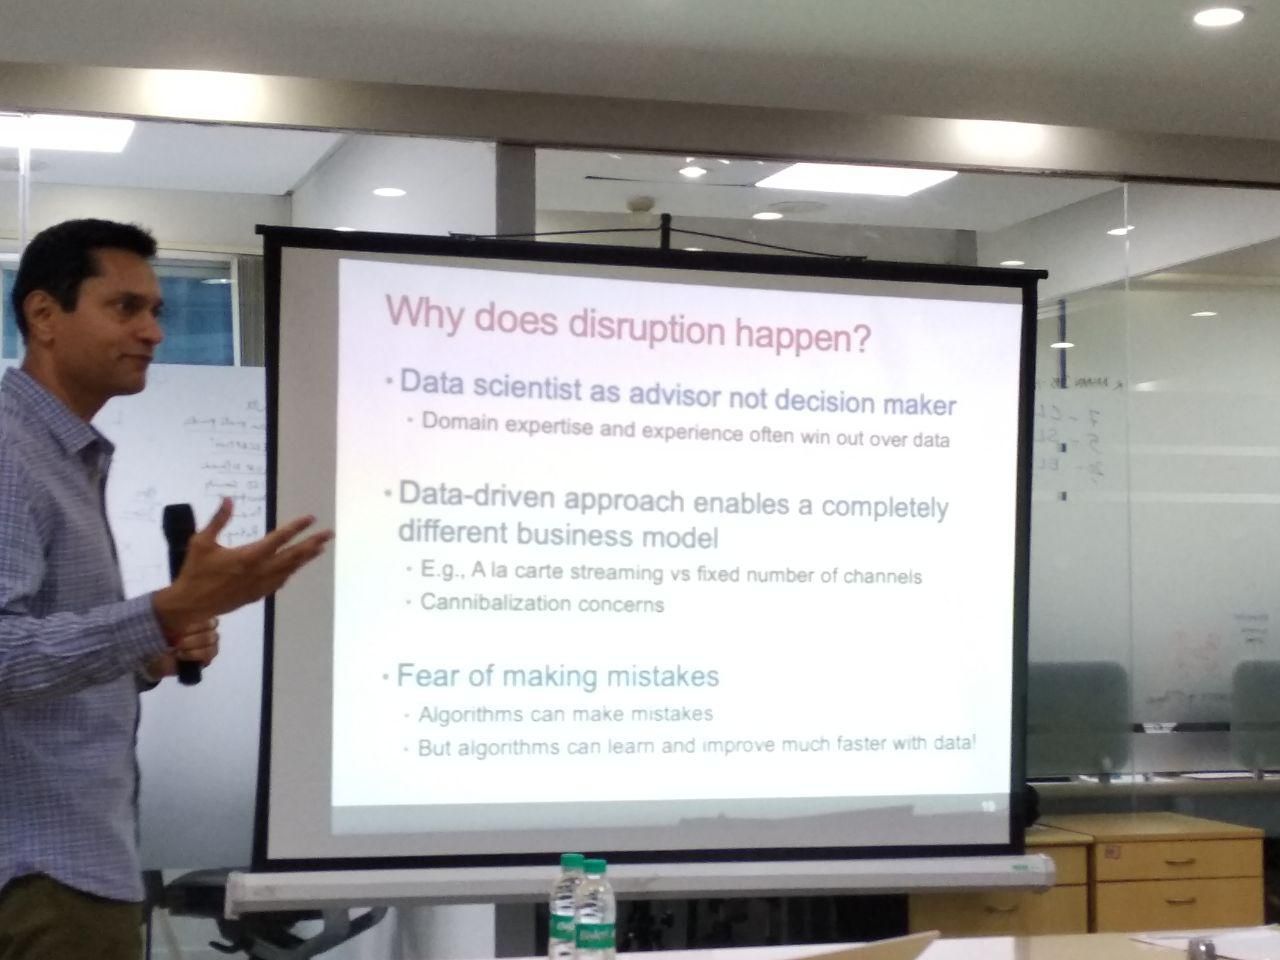 Why does Disruption happen?
Another key question which Anand urged the audience to think about was: Whether they should use data to optimize existing products or create completely new disruptors? Though there is a scope for both types of innovation, he advocated thinking about disrupting existing business models by new ways of using data. For example, rather than using AI to optimize revenue for hospitals, can AI and data be used to create a new type of hospitals?
Why does Disruption happen?
Another key question which Anand urged the audience to think about was: Whether they should use data to optimize existing products or create completely new disruptors? Though there is a scope for both types of innovation, he advocated thinking about disrupting existing business models by new ways of using data. For example, rather than using AI to optimize revenue for hospitals, can AI and data be used to create a new type of hospitals? 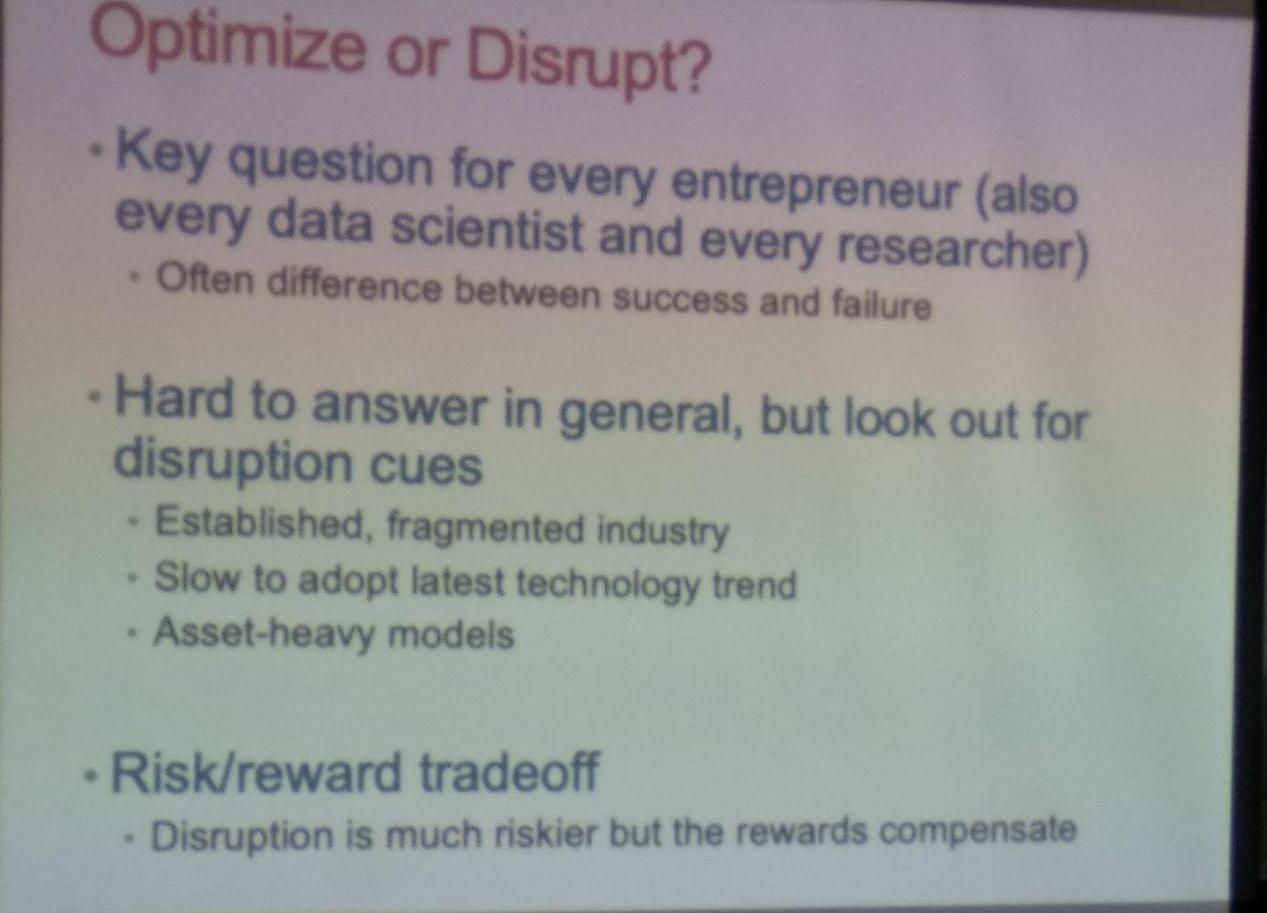 Optimize or Disrupt?
Anand also practises what he preaches. In his current firm
Optimize or Disrupt?
Anand also practises what he preaches. In his current firm 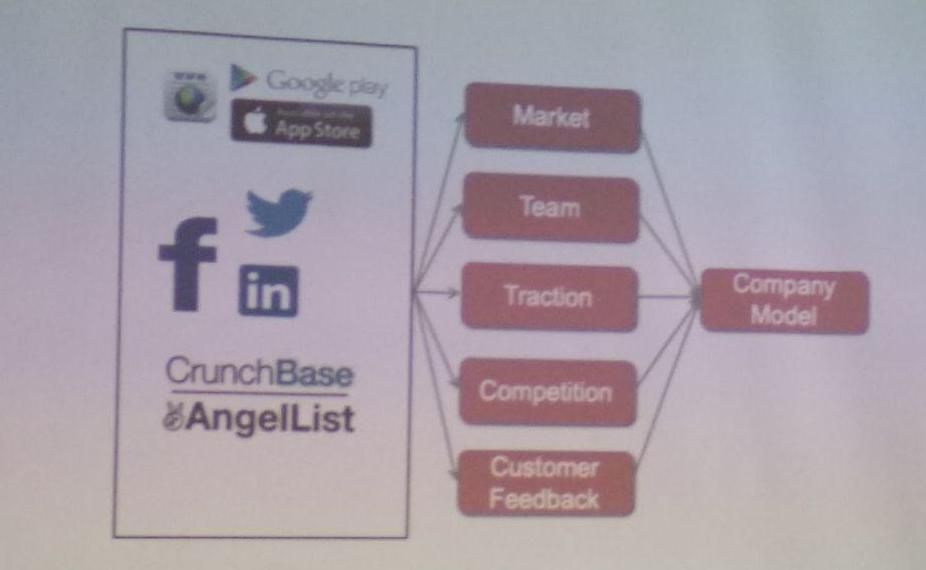 Rocketship.vc Company Model
Though using data objectively in itself is an art. You can use the same data to tell different stories and succumb to the confirmation biases. The key is to have mechanisms to keep such biases in check and let the data tell the story rather than use data to confirm your story.
Rocketship.vc Company Model
Though using data objectively in itself is an art. You can use the same data to tell different stories and succumb to the confirmation biases. The key is to have mechanisms to keep such biases in check and let the data tell the story rather than use data to confirm your story.